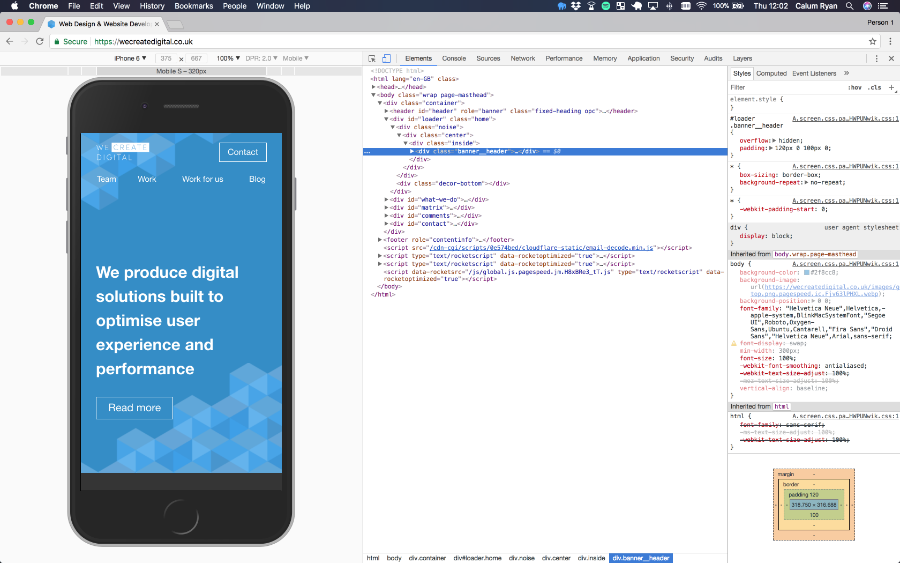
Inspect Element
Using Inspect Element will help speed up debugging issues as well as writing style modifications to an existing layout before writing and saving them into your project. All modern desktop browsers include an inspect element feature. For mobile this is more tricky to do directly on a real device but there is a feature in Chrome to visually test at different breakpoints and viewport simulation.
We tend to use both Chrome and Firefox inspect element features. Both have advantages, for example, we tend to find it easier to find out about cookies on a website on Firefox vs. Chrome.

When using Inspect Element make use of the performance and memory features to analyse the page load and highlight any unnecessarily large assets or scripts that could be compressed/minified further.
Network tab
Typically, the network tab is most helpful for seeing what is happening behind the scenes. You may use this to see:
- What the response is after an AJAX call
- What resources are loading for the current page
- What POST data is submitted
- How many requests are made on the page
- Seeing whether the initial request was 301 redirected
- Seeing whether any requests returned 404 or similar
- What other external resources are being used and frequently they are requesting data
Console debugging
The console tab is an incredibly useful tool to see whether there are any errors or warnings on the page you are visiting. These are not immediately visible to the end user but may explain whether some functionality is not working.
The console tab is also very helpful for quickly identifying 404s and other similar server errors.